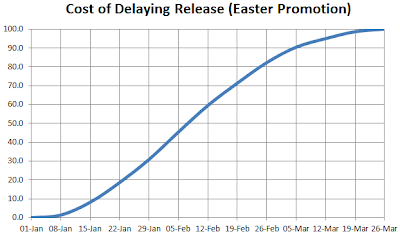
Expedite items have a high and immediate cost of delay. They should be started at once and given priority over other items. Fixed date items have a high cost of delay once a threshold is passed. They should be started before there is a significant risk this date will not be met. Standard items' cost of delay follows a fairly shallow S-curve, in other words, there is no reason to expedite them - they should be handled normally. Intangible items apparently have no immediate cost of delay, though it is expected to rise at some more distant point in the future. Such items are useful background tasks to be handled when there are no more urgent tasks.
At a recent Kanban Masterclass I attended, David introduced an example to demonstrate the difference between Fixed Date Items and Standard Items:
A hotel/resort site wishes to offer two special promotions: one for the Spring/Easter holiday; one for Valentine's Day. Because people tend to book much later for Valentine's Day, the opportunity-cost of delay is likely to be much "steeper" - more like the Fixed Date case, compared to a more "Standard" shape for the other promotion.
This led to consideration of what the revenue projections for different release dates might be in these 2 cases, so I undertook to produce some sample data for discussion. Here they are.
The graph above shows the imagined additional sales generated by launching the Easter promotion on the dates shown. There's no point in launching before Christmas and New Year are over (zero cost of delay), so the first release date is January 1st. There's an initial bump when the first ads go out, then a growth in revenue, and in this case a rapid drop off when it is anticipated all places will be sold. Later releases follow a similar pattern but after 5 or 6 weeks' delay the cost in lost sales becomes much higher as sales go to the competition or simply have insufficient time to close.
The graph above plots the loss of revenue of the early February release (5 weeks delay) compared to 1st January release. Sales are always behind - even after the slight recovery in the period after the January release has sold-out.
Taking all the potential release dates and plotting the opportunity-cost for each delay produces the graph above - an S-curve showing little impact initially, rising more rapidly after the first couple of weeks.
Let's compare that with the simulated data for the Valentine's promotion.
In this case we are expecting nearly all the sales to be made in the last couple of weeks before the event. It really doesn't help to launch early because people won't book early any way!
So plotting the cost of delay in this case we get a curve which is much closer to the archetypal step function of the Fixed Date items. If there are items with higher opportunity cost of delay early on in the year, it is more beneficial to do these items, provided we don't miss the late January release for the Valentine's promotion, i.e. the point where the curve hits the "hockey stick" upwards.
Hopefully these examples help the understanding of the concept of using cost of delay for deciding which item an agile team should do next. Let us know if you have any real data examples to demonstrate this concept. I'd be most interested to hear about them.


No comments:
Post a Comment