Don Reinertsen in his book Flow [1] has shown that, if you want to deliver the maximum business value with a given size team, you give the highest priority, not to the most valuable work items in your "pool of ideas," not even to the most urgent items (those whose business value decays at the fastest rate), nor to your smallest items. Rather you should prioritise those items with the highest value of urgency (or CoD) divided by the time taken to implement them. Reinertsen called this approach Weighted Shortest Job First or WSJF (sometimes pronounced wizjiff!). WSJF is a variation of the Shortest Job First scheduling algorithm used in computer operating systems. By adding urgency as a weighting, both time and value contribute to the decision-making.
In this series of articles, of which this is the first, we return to the topic of Cost of Delay (previously addressed 3 years ago in Selecting Backlog Items By Cost of Delay), and how CoD can be applied in Kanban. I'll explain the terminology used in the recently published book Essential Kanban Condensed [2] - including why this differs slightly from that used by some other authors - and how you can apply this knowledge in Kanban, potentially combining it with the use of Classes of Service. In particular we will look at the simple mathematics applied in WSJF and the assumptions that make it valid or invalid in different circumstances.
Here are the links to the articles in this series:
Part 1: Understanding Cost of Delay and its Use in Kanban (this article)
Part 2: Delay Cost and Urgency Profiles
Part 3: How to Calculate WSJF
Part 4: WSJF - Should you divide by Lead Time or by "Size"?
Part 5: Others may follow...
Here's what the weekly business benefit graph looks like...


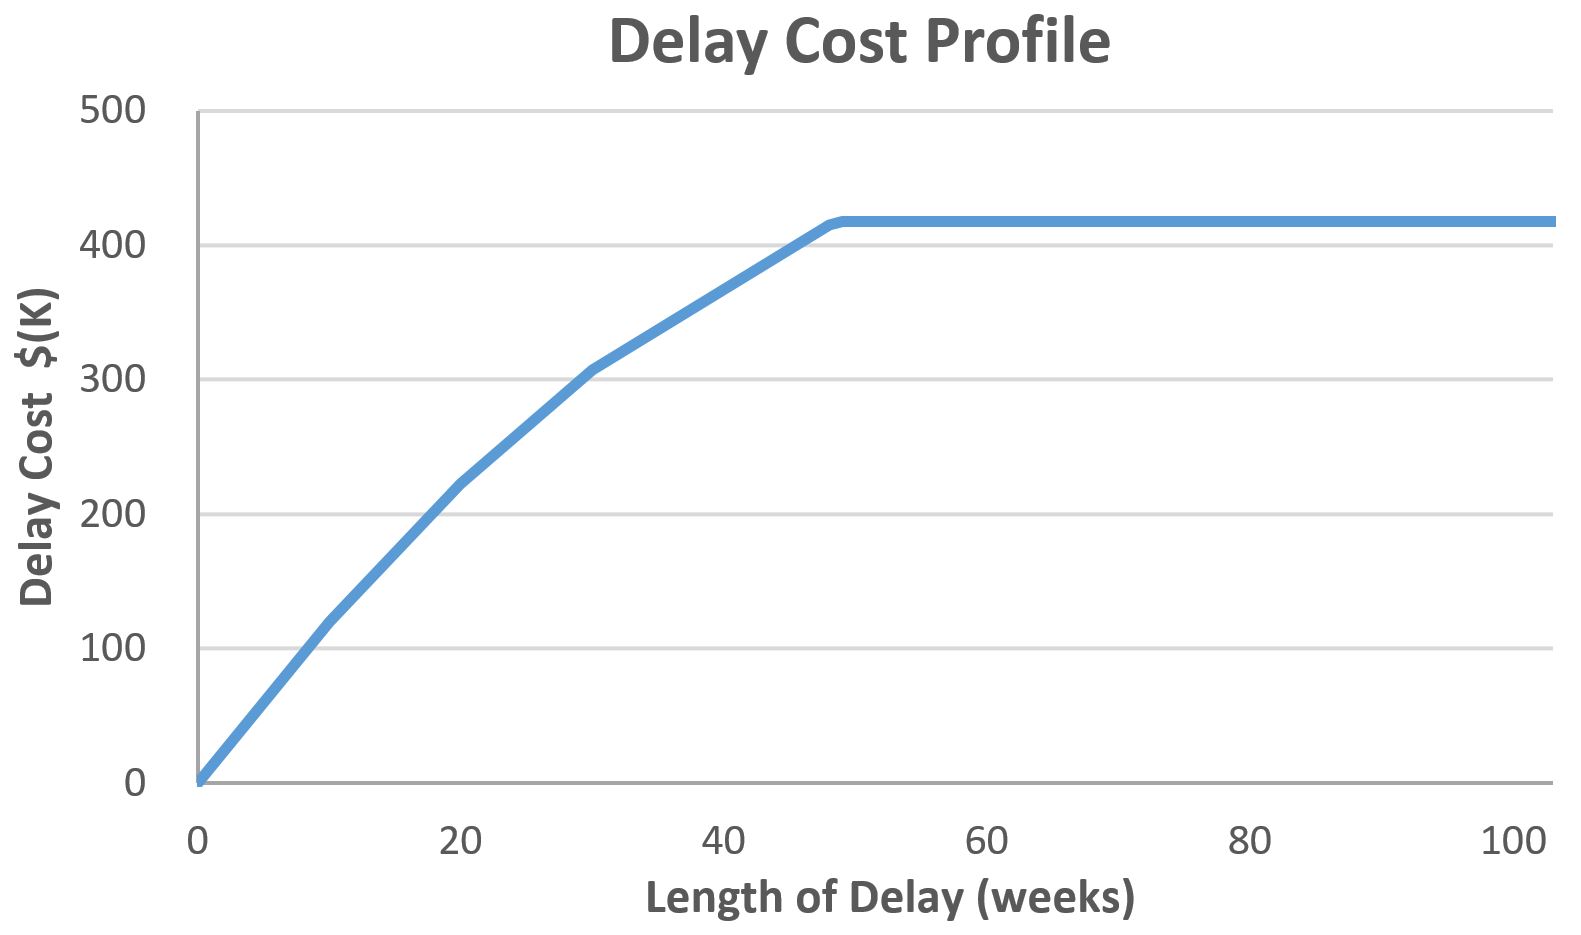
The next step is to plot the Delay Cost against the length of the delay. This graph is referred to as the Delay Cost Profile. There are a number of archetypes that different authors have identified [3, 4] that can help us identify the likely profile in given scenarios. We'll look at these in more detail in Part 2 of this series. Here's the Delay Cost Profile for our feature:
We refer the rate at which value is lost as Urgency or Cost of Delay (the first derivative of Delay Cost). It is important when reviewing materials on CoD - particularly when looking at graphs plotted against time - to clarify whether the term referred to is Delay Cost measured in currency (e.g. $) or Urgency/Cost of Delay (measured in currency per length of delay, e.g. $ per week). It is unfortunate that the 2 terms commonly used here - Delay Cost ($) and Cost of Delay ($ per week) - are so close in natural meaning (translators have nightmares!). For this reason the Kanban glossary suggests an alternative term for the rate at which value and Delay Cost changes - Urgency.
When Urgency is plotted against the date of availability (or the length of delay, if starting from a reference date), the graph is referred to as the Urgency Profile.
Here is the plot of the Urgency Profile for our example:

We can see from this graph that Urgency is diminishing in this case, as the market opportunity is also disappearing. Reinertsen and Preston Smith [5] noted that the sense of urgency in organisations often runs in the opposite direction to the market opportunity - they named it the Urgency Paradox, the "cruel tendency" for this sense of urgency in product development to be highest when the real urgency, as reflected by market opportunity, is lowest and vice versa.
We will see in future articles in this series how different kinds of work item have different Delay Cost and Urgency profiles, and how we can use this with WSJF to help the scheduling of work to maximise the delivery of business value. We'll also examine the degree to which a quantified approach (using numerical estimates of business value and its rate of decay) can be used in practice, and whether alternative approaches such as the use of profile archetypes with scaling factors can be as or more effective.
Note: This article has been updated since its first publication to be consistent with the latest version of the glossary in Essential Kanban Condensed [2].
Now read part 2: Delay Cost and Urgency Profiles
The Cost of Delay Series:
Part 1: Understanding Cost of Delay and its Use in Kanban (this article)
Part 2: Delay Cost and Urgency Profiles
Part 3: How to Calculate WSJF
Part 4: WSJF - Should you divide by Lead Time or Size?
Part 5: A "Qualitative" Formula for WSJF?
Part 6: Time is an Asset - Delay is a Cost
References
[1] Donald G. Reinertsen. The Principles of Product Development Flow, (United States: Celeritas Publishing. 2009)
[2] David J. Anderson and Andy Carmichael, Essential Kanban Condensed. (United States: Lean Kanban University Press. 2016)
[3] David J. Anderson. Kanban: Successful Evolutionary Change for Your Technology Business (United States: Blue Hole Press, 2010)
[4] Joshua Arnold and Özlem Yüce. “Using Cost of Delay: Experience Report – Maersk Line.” Black Swan Farming. (2013)
[5] Preston G. Smith and Donald G. Reinertsen. Developing Products in Half the Time. (United States: John Wiley and Sons. 1998)
[6] Ian Carroll. “No Correlation Between Estimated Size and Actual Time Taken.” IanCarroll.com. (2016)
[7] Joshua Arnold. "Qualitative Cost of Delay." Black Swan Farming. (2016)


No comments:
Post a Comment