Monday, January 11, 2021

Breakout sessions that ensure everyone in the meeting meets everyone else

Lockdown finds us doing more and more in online meetings, whether it's business, training, parties or families. It also finds us spending inordinate amounts of time on trivail and time-consuming tasks of dubious value. This blog explores exactly such a problem!

I recently wanted to find a way to divide an online meeting into several breakout sessions, ensuring at the end of them, everyone would have met everyone else. But how many sessions of what size would I need, and how could I put the right people in the right group in each session?

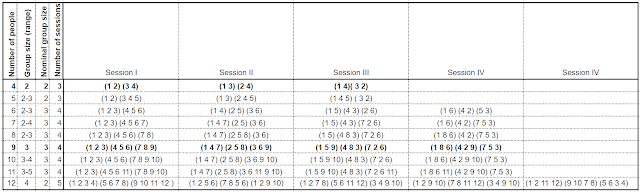
After a brief internet search which didn't answer my question (I know someone's done this before, and probably written about how to do it, but I didn't find them!) I decided to work it out myself. Here's my attempt for groups of between 4 and 12 - minimising the number of breakout sessions, the number of people that meet people twice, and variation in group size.


Let me know if you're keen to extend this to larger groups.

Some further thoughts on approaching this problem

Let's start simply. If I had 4 people, I could easily put them in 2 groups of 2 people. I'll number the people from 1 to 4, so here's my first session...

Session A: (1,2) (3,4) ... start at 1 and add 1 each time

Everyone's now met one person. Since they meet 1 person in each session, and there are 3 other people to meet, I need 2 more sessions:

Session B: (1,3) (2,4) ... start at 1 and then 2, adding 2 
Session C: (1,4) (3,2) ... start at 1 and add 3 (mod 4) each time

It turns out I can do this with any even number of people, put into n groups of 2 people*. After the correct (2n - 1) sessions, they all have met everyone. Here's a solution for 8 people for example, with 7 sessions, each with 4 groups of 2):

Session A: (1,2) (3,4) (5,6) (7,8) ... start at 1 and add 1 each time
Session B: (1,3) (5,7) (2,4) (6.8) ... start at 1 and then 2, adding 2 each time
Session C: (1,4) (7.2) (5,8) (3,6) ... start at 1 and add 3 (mod 8) each time
Session D: (1,5) (2,6) (3,7) (4,8) ... start at 1,2,3, and 4, adding 4 each time
Session E: (1,6) (3,8) (5,2) (7,4) ... start at 1 and add 5 each time
Session F: (1,7) (5,3) (2,8) (6,4) ... start at 1 and then 2, adding 6 each time
Session G: (1,8) (7,6) (5,4) (3,2) ... start at 1 and add 7 each time

These get more laborious to work out with larger numbers, but anyway there are too many sessions when there are a lot of people; better to have larger groups with fewer sessions. 

For groups of 3, you need at least 9 people**. 9 people can meet everyone else in 4 sessions with groups of 3 (there are 8 others to meet, and you meet 2 in each session).

Session A: (1,2,3) (4.5.6) (7,8,9) ... start at 1 and add 1 each time
Session B: (1,4,7) (5,8,2) (9,6,3) ... start at 1,5 and 3, adding 3 (mod 9) each time 
Session C: (1,5,9) (4,8,3) (7,2,6) ... start at 1 and add 4 each time
Session D: (1,8,6) (4,2,9) (7,5,3) ... start at 1 and add 7 each time (adding 5 clashes wih group A, adding 6 clashes wih group B)

The next feasible number with groups of 3 (where nobody meets the same person twice) is 15. That's 5 groups of 3 for 7 sessions.

The next square number, 16, divided into 4 groups of 4 can be designed so everyone meets everyone else in 5 sessions. These two problems are left as an exercise for the reader! 

(Send me your workings when complete. :-)


Notes:

* You can design groups of size n where people meet once and only once provided the number of people N is divisible by n, and (N-1) is divisible by (n-1). That is all even numbers for groups of 2, all odd multiples of 3 for groups of 3, etc. (Note: If n is the number in the groups, we need the number of people, N, to be divisible by n so there's an equal number in each group, but in addition we need (N-1) to be divisible by (n-1) so we have a whole number of sessions.

** It turns out n squared is the minimum meeting size with n people in each breakout group, in order to meet everybody once and only once.

Thursday, January 03, 2019

Why do organisations fail to achieve business agility?

Recently I was asked to participate in an Interview Series by Noopur Pathak of Innovation Roots, an Agile consultancy based in Bengaluru and several other cities. One of the questions she asked me was why organisations fail to achieve business agility.
Here's an excerpt from my reply.

 Do you want to be agile?

There are many more reasons organisation fail to become agile than there are to succeed, but the first question to ask organisations is what they want to achieve. Is business agility one of those things? Because if you are in a very stable situation and you have very stable business, agility isn’t necessarily on the priority list of what must be achieved.

On the other hand, nearly all organisations – including those in industries we consider most stable, where nothing seems to have changed in decades – face the disruption of new ways of doing business, and innovators entering into their markets. It means everybody must think about the need to change… the need to change fast. Remember: “It’s not the big fish that eat the small ones, it’s the fast that eat the slow!” If your organisation is slow, there is a good chance that your competitors or new entrants into the market will disrupt it and take market share.

So the first question is, “Is agility an aim for the organisation?” If it isn’t, you won’t achieve it. If you realise that you do need to become agile, there are still many reasons why you may fail.

A failure to plan

For example, you need to plan to become more agile (more able to respond rapidly to changing market conditions), and you need to invest in those plans. If you want to encourage innovation, you need to communicate that goal to staff and show how you will reward it. Traditional command and control approaches to managing business, and fixed long-term goals, won’t work, particularly if disruptors are already entering your market and introducing new ways of working more successfully than you are. You have to think about the way the organisation can empowers its staff, and allow them to think differently, to try new things in a safe-to-fail manner. That allows the organisation to discover different ways of working. Agility comes from the chosen strategy of an organisation, and from its leaders’ ability to communicate and encourage staff to implement that strategy.

It's not just IT

When people say the word “Agile”, they are often only thinking about it in the context of software development. That software is important to business agility is not in question. Software has “eaten the world,” it is the driver for business transformation, it is the foundation of digital solutions. The way you create software, and the way you plan, manage and finance software development is crucial if you want to achieve business agility. However, I encourage leadership teams to consider first why they want to achieve business agility, and what it involves in terms of the changes needed in their organisation. Then they can start planning, not only how it will change software development, but also every other area of the business. Each area, just like the software teams, must invest in new ways of doing business, must try multiple things to see what works; must act before knowing if it will work, learning from failures and exploiting successes. Rather than waiting for the fully developed ideas – the big up-front plans with every component costed and all outcomes forecast, the big implementation and the big-bang delivery – smaller steps and more learning on the journey is essential.

These are strategies for moving faster than your competitors and ensuring survival in rapidly moving markets. That’s why business agility is important. It answers the existential question of how we survive in this rapidly changing world, where organisations can quickly discover they are no longer fit for the new competitive landscape.

Back to some of the reasons for failure to achieve business agility:
  • Not wanting it
  • Wanting, but not planning for it
  • Planning, but not investing in it
  • Not seeing through the changes
  • Not dealing with the negative consequences of innovation in the organisation – not ensuring there is safety in both failed experiments, and successful ones that disrupt existing parts of the business. 

There is no formula

One other thing. People think there is some magic method or strategy or formula that makes organisations agile. There are principles to learn, but there is no formula. Applying those principles in the unique context of your business, your market and your people – and helping your people to innovate – is where business agility comes from.

You can read more of this interview at: innoroo.com/blog/

Wednesday, June 27, 2018

Webinar July 6th - Essential Kanban: It's all about FLOW!

Customers are always saying "Why is not done yet?" and staff are always saying "We're too busy." But what's the real problem? Kanban has the key!  

Sign up Now!

Kanban is a way to visualise and manage your team's (and your organisation's) work, and the first crucial insight it brings is that it's the flow of work, not the busy-ness of staff, or the efficiency of each worker, that bring value to your customers and profitability to the business. This half-hour webinar introduces you to the foundational concept of Kanban - FLOW - and it will set you on the road to find out more.
Don't miss it!
Webinar duration: 30 minutes, plus questions and discussion
This webinar is a great introduction to Kanban for those new to it, but also a great resource for those familiar with the method, and looking for a straightforward and short description of one of its key ideas. Why not invite your colleagues too, perhaps to kick off an informal discussion of how you can use these ideas at work?

Wednesday, February 28, 2018

Kanban: How to Start; How to Scale

How to start...

Several years ago I published my shortest possible advice on "How to start using Kanban". Not being restricted by arbitrary limits like 140 characters, I would express these steps today as:
  1. See your work as a flow of value to your customer
  2. Start from where you are
  3. Visualize your work, your process and your policies
  4. Adopt validated changes that improve things
Note that the first three of these steps do not involve changing what you are currently doing, how you are doing it, who is doing it, or what their role is called. The changes are: to your viewpoint (Kanban is a way of seeing, as much as it is a way of changing); to your approach to change (in an evolutionary way, from where you are); and to the use of visualisation (to make invisible knowledge work visible, as well as the process and policies - like controlling WiP - that apply to it).

The fourth step though, is to start improving things. It's good to see that previous critics of Kanban are recognising the value of these lessons, even where some of a process's previously inviolable "rules" might be breached. Provided we have a clear idea of what makes a product, a process, or an organisation fit for purpose, and provided the changes proposed can be shown to improve things, it's foolish not to change.

Kanban is often caricatured as only being applicable to small teams (say 3-12 people), or to processes with only small work items. In fact, this process of visualising the work and process, and improving the flow of value using Kanban's general practices, is applicable across a wide range of scales, contexts, and organisational maturity.

So if you're starting from a few teams using Kanban at the team level (a reasonable place to start by the way), how do you scale to using Kanban across an organisation?

How to scale...

We can express the answer to that question with 4 quite similar steps:
  1. See your organisation as a network of inter-dependent services
  2. Scale out sequentially, service by service
  3. Design each service independently from first principles
  4. Use feedback loops through the management system to achieve balance and improve service delivery to customers
Like the first "how-to", this one starts with changing how you see. I've spoken more about this in my sessions on the Kanban Lens. The way we "see" - our instinctive way of modelling the world around us - has the greatest impact on our interpretation of new situations and ultimately our behaviour. Letting how you see change is a most powerful door into new possibilities.

Specifically "seeing services" is not instinctive. We're more likely to look at organisations through a "departmental" lens (people with similar functions or roles in the the organisation), or through a "small team" lens (the groups of people that get things done together). What is often missing is how departments and teams fit together to deliver value to the organisation's "customers". Changing to that as your default viewpoint, brings quite different issues into focus. It has a powerful impact.

Scaling out service by service again may not be management's instinctive approach. If we've found a better process, why not roll it out across the whole business together, in the shortest possible time? The answer to that question lies in Kanban's foundational principles, specifically the change management principles. These can summarised as "start from what you do now... and change in an evolutionary manner, learning and applying the lessons learned as you go." In practice, that's what the most successful organisations have found as they roll out Kanban. It is not slower to move incrementally. You get there faster because you don't generate massive fear and resistance within the organisation, and most importantly you learn as you go, while it's still not too late to apply the lessons.

If you want to know more about the third step - often referred to as STATIK (systems thinking approach to introducing Kanban), we discuss it (albeit briefly) in Essential Kanban Condensed. It's one of the main elements in the KMP 1 training syllabus - see this course from Huge.IO for example, Kanban System Design.

Finally the fourth step - using the Kanban Cadences, is the subject of the next blog (as well as the follow-on training . Watch this space.


References and Credits
Anderson, David J. 2016. "Kanban’s Change Management Principles", Lean Kanbanhttp://anderson.leankanban.com/kanbans-change-management-principles/
Anderson, David J., and Andy Carmichael. 2016. Essential Kanban Condensed. Lean Kanban University Press. http://leankanban.com/guide
Carmichael, Andy. 2013. “How to Adopt Kanban”, Improving Projects.http://xprocess.blogspot.co.uk/ 2013/05/how-to-adopt-kanban.html
Carmichael, Andy. 2013. “There are 6 general practices of Kanban...”, Improving Projects.   http://xprocess.blogspot.co.uk/2013/04/there-are-6-core-practices-of-kanban.html
“Kanban (development)”. Wikipedia. Retrieved July 7, 2017,https://en.wikipedia.org/wiki/Kanban_(development)


Monday, February 26, 2018

The Kanban Lens: a way to see

The Kanban Lens is a way to see your work. Specifically it asks us to see:
  • work as flow 
  • workflow as knowledge discovery steps
  • knowledge work as a service
  • organizations as networks of services
I got involved with the Kanban community not very long ago - in 2012. I wanted to understand what the Kanban method was. People were saying “it’s better than this” or “worse than that”. But they weren't telling me what it was! The only detailed explanations came from critics or tool vendors, and to be frank neither of those sources were particularly reliable. I knew about the general practices of Kanban and its principles for change management. I even understood kanban systems, which are used in Kanban, just as they are in manufacturing and delivery systems, to ensure we only start work when our customers actually want it, and we have the capacity finish it.
Video of the "Kanban Lens" lightning talk (7 minutes)

But that still didn’t explain what the Kanban method was.

A few years ago Rodrigo Yoshima used an eye-opening phrase in a talk he did at Lean Kanban North America: the “Lean flow paradigm”. It helped me understand that Kanban is not a process, or a recipe, or a framework. It’s how to see work. This is what brings together the many and various parts that make up the Kanban method. In 2013, David Anderson blogged about this, coining the phrase “the Kanban Lens” and recently I’ve been talking to David again about its definition, looking for a simple form of words that captures the Kanban “way of seeing”.

There are four elements to the Kanban Lens.

1. See work as flow

Firstly… “See work as flow.” Or more explicitly: See work as a flow “from customer need, to needs met.” This is the starting point for using Kanban. Before you change the organisation, or the process, or the roles and responsibilities, or anyone’s job title, change how you view your work. Seeing work as flow may seem obvious. Except that this is completely against most managers' and most professionals' instincts. It's not how work is traditionally managed. When you look at what people actually do, it's clear; most of us are more concerned about people who are not busy, than work items that are not flowing!

Change your viewpoint. Don’t view your work as being busy at your skill, or your role. Work has value because, we fulfil customers’ needs. By visualising work and ensuring it's made up of small, distinct items, the flow of work becomes visible. Ensuring each work item is coherent and valued by the customer, means genuine value can be delivered to the customer as each item is delivered.

That’s how work flows. Workflows... that's the second element of the lens...

2. See workflow as a sequence of knowledge discovery steps

Workflow as a sequence of knowledge discovery steps is something that often puzzles people. It cuts across how we've traditionally looked at workflow - as hand-offs between individuals or teams. However the columns on a kanban board should not be viewed as representing the teams of people that handle the work. Look through a different lens. The workflow shows the progress of the work item, through different learning activities, until we know enough about each item, to convert the ideas and options into delivered value.

“Really? How can we expect a linear monotonic process to represent such complex activities?”

The answer is that we don’t, and it doesn’t. The steps in a Kanban process are states of the item. In each state there’s a dominant means of learning (of knowledge discovery), using people and skills as needed. This is how to build effective, improvable services.

3. See knowledge work as a service

The third element of the Kanban lens is to “See knowledge work as a service.”

Again this raises eyebrows. “Isn’t it obvious that knowledge work is a service? Accountants and tax men call it a service. The product is intangible. There is no manufacturing involved.” But that’s not the source of the controversy. Our instinct is to manage what’s visible – the people; rather than what’s invisible – the work being produced. The Kanban Lens asks us to focus on the work, not the workers, and to see that work as a service.

A service implies the existence of a customer, needing, and ultimately benefiting from, the work.
It implies care on the part of the service provider…
  • to know what makes the service fit for the customer’s purpose, and 
  • to what degree, and when, it can be delivered.
Sometimes a service delivers to an internal customer. That’s okay, indeed it’s inevitable in larger contexts. But don’t lose sight of the real customer, nor those that deliver direct to that customer. Our work enables them to fulfil customer needs.

4, See your organisation as a network of services

Multiple inter-dependent services require organising, and that's where the fourth element of the lens comes in. “See your organisation as a network of services.”

Network here is a general term. Typically we see
  • chains of services 
  • hierarchies of services, and
  • inter-connected services 
We can even see multiple services on a single board, as this one from Wikipedia, which has chains of services… (sequences), hierarchies of services… (decomposed work, with the lower level items handled by different services), and inter-connected services… (where blockers on work items on this board are work in someone else’s service).
Sample Kanban Board.png
[CC BY-SA 4.0 (https://creativecommons.org/licenses/by-sa/4.0)], via Wikimedia Commons]

These networks must be balanced by adjusting the policies and resources to ensure flow and timely delivery. Management cadences for improvement are therefore vital, particularly an Operations Review, which interacts with multiple services.

Scaling Kanban depends on this first step of seeing the organisation differently… as a network of services. The "org. chart" is no help for this. But when people see the services, and their customers, they can
  • self-organise to the work
  • cut the waste of siloed thinking and redundant activities, and
  • generate improvements from within… across the organisation.
This is what “Whole Organisation Kanban” means. It’s all a part of looking at work differently, using the Kanban Lens to...
  1. See work as flow (from customer need, to needs met), 
  2. See workflow as a sequence of knowledge discovery steps
  3. See knowledge work as a service
  4. See your organisation as a network of services
That’s the Kanban Lens!


References and Credits
Anderson, David J. 2011 “Understanding the Process of Knowledge Discovery”. DJAA blog: http://www.djaa. com/understanding-process-knowledge-discovery
Anderson, David J. 2013 “The Kanban Lens”. DJAA blog: http://www.djaa.com/kanban-lens
Anderson, David J., and Andy Carmichael. 2016. Essential Kanban Condensed. Lean Kanban University Press. http://leankanban.com/guide
Carmichael, Andy. 2013. “How to Adopt Kanban”, Improving Projects. http://xprocess.blogspot.co.uk/ 2013/05/how-to-adopt-kanban.html
Carmichael, Andy. 2017. "Sample Kanban Board“, CC BY-SA 4.0 via Wikimedia Commons. https://commons.wikimedia.org/ wiki/File%3ASample_Kanban_Board.png 
Ebbesen, Bill. “Lenses” Photo. Transferred from en.wikipedia, CC BY 3.0, https://commons.wikimedia.org/ w/index.php?curid=11430342
“Kanban (development)”. Wikipedia. Retrieved July 7, 2017, https://en.wikipedia.org/wiki/Kanban_(develop ment)
Kennedy, Michael. 2012. “Set-Based Decision Making”, Lean Software and Systems Conference, Boston, MA. Video: https://vimeo.com/42785298
USDA, “Large format camera” Photo.  PD-USGov-USDA-ARS. https://commons.wikimedia.org/wiki/File%3A Large_format_camera_lens.jpg

Yoshima, Rodrigo. 2013. "Management and Change - Avoiding the Rocks," Lean Kanban North America, https://www.slideshare.net/rodrigoy/management-and-change-avoidin.

Zheglov, Alexei. 2014. “Beyond VSM: Understanding and mapping your process of knowledge discovery”, Lean Kanban Central Europe. Slides: https://goo.gl/ay6P7U, Video: https://vimeo.com/ 114542264 

Friday, May 12, 2017

Time is an Asset - Delay is a Cost

Cost of Delay is a vital concept for management teams to understand and use. It enables better decision-making concerning investments and cost-saving, and is the basis of a coherent economic framework for considering the trade-offs management are responsible for, when deciding for example, whether to focus on reducing cost, or on investments that might reduce costs or increase value in the future.

After over a year of blogging and conference presentations on the topic - much of which has focused on the technical rather than practical explanations - I want to draw these to a close here with some straightforward summaries for managers of agile teams. While I think most managers will benefit from looking more deeply at why this advice applies (and its limits based on the assumptions underlying it), I'm also clear that a summary of what to do is the most helpful.

My thinking has evolved over the year, since the preparation and publication of the Kanban guide to Kanban - Essential Kanban Condensed (downloadable here). I started this series of blogs in April 2016 to provide more details on the subject than was possible to include in the condensed guide, and since that time I've had the good fortune to discuss Cost of Delay in some depth with some key thinkers on the subject. For this I'm particularly grateful to Don Reinertsen [1,8], David Anderson, Joshua Arnold [4,7], Chris Matts and Dave Snowden [9], who have taken the time at various points this year to teach, cajole, contradict or endorse various things that I was saying. While it is certainly not possible to reconcile all the thoughts and published works of the authors who have used and modified Don Reinertsen's original work on the subject - it is now at least possible to summarise my own (interim) conclusions!

Firstly here is the list and links to each of the previous articles:

Part 1: Understanding Cost of Delay and its Use in Kanban
Part 2: 
Delay Cost and Urgency Profiles
Part 3: 
How to Calculate WSJF
Part 4: 
WSJF - Should you divide by Lead Time or Size?
Part 5: A "Qualitative" Formula for WSJF?

Part 6: Time is an Asset - Delay is a Cost (this article)

In this article I look first at some key terms we have used. I then ask, and hopefully answer, "why is Cost of Delay important?"; "can Cost of Delay be quantified?"; "when could we use WSJF?"; and finally "what next?".

Terminology

Three useful terms...Unfortunately there is not unanimity on terminology but these ones are important. The first 2 terms below follow Don Reinertsen's work. The third, a term Joshua Arnold used when correcting the dimensionality of SAFe's use of Cost of Delay, was discussed in the previous blog [10]. (Other terms are introduced in the previous blogs and are available in the glossary of Essential Kanban Condensed.)

Cost of Delay (CoD) - the rate of decay of value per period of delay. Units for example could be dollars per week. Due to the confusion possible with the next term in this list, I frequently use Urgency (U) as a synonym for CoD.

Delay Cost - the total loss of value due to a delay of known duration. For example, "The release was delayed by 7 weeks, which resulted in a Delay Cost of $150,000".

Time Criticality - a relative measure of how quickly all the value of an item would be lost. Units are the reciprocal of time. Usually this is used as an informal and relative term. It is useful though to compare the concepts of Time Criticality (which is independent of value) with CoD/Urgency, which quantifies value lost per time. For example eating the lettuce approaching its use-by date in the fridge may have the same Time Criticality, but very different Urgency, compared to paying the final demand on the mortgage on the house!

Three useful graphs:

Benefit Profiles - these show the benefit accrual rate expected from a defined piece of work, plotted against date, for example net pre-tax profits expected per week. There is not unanimity concerning this term. David Anderson frequently refers to these plots as "adoption curves" since for product releases the benefit accrual rate follows the adoption of the product by customers. Joshua Arnold often calls these graphs "urgency profiles", which unfortunately clashes with the definition below. (Since the graphs do not actually reveal urgency - this can only be determined by comparing one benefit profile with a subsequent one incorporating a delay - I would discourage this usage.)

Delay Cost Profiles - these are plots of delay cost against the delay (or release date, if you prefer). The gradient (first derivative) of these curves shows the CoD or Urgency.

Urgency (or CoD) Profiles - these plots should how the Cost of Delay is expected to vary over time. Of particular importance is: where there is a spike in CoD (as for example occurs if there is an external deadline); or where there is a continuing change in CoD (as for example occurs when there is expected loss of market share as well as loss of earning period due to the delay); or where step changes occur (as happens at the start and end of expected earning periods).

See the first blog in this series for examples of these three types of graph.

Why is Cost of Delay Important?

Traditional business cases for new work use estimates of cost and benefit to derive Return on Investment (yield) and a pay-back schedule (duration). However the rate at which value is lost due to delays is not  taken into account. As a result we live with the consequences: arbitrary cost cutting by activity type (such as travel bans and contractor “holidays”), a failure to invest to reduce lead time, and an inability to trade-off cost for time. It also means the choice of initiatives undertaken, and the order they are implemented when they cannot or should not be carried out in parallel, is poorly informed. These discussions need accountants and software managers to share vocabulary (and goals)… and ultimately to evolve policies that improve outcomes. Cost of Delay needs to become part of the every day discussions of management.

Can Cost of Delay be Quantified?

My short answer to this is "yes, but it cannot be measured" (apologies to Don Hubbard, who would correct the definition of "measured" that I'm using here and say yes it can!). The point is that Cost of Delay is the difference between: something that cannot be measured until after the project has finished (life-time benefits for the work); and something that cannot be measured at all since it relates to something that will never occur (life-time benefits of the work if it had been released on a different date). Since we are estimating CoD it is worth having this in mind - not to prevent its use but to realise its limitations. Even after the fact we will not have a definitive answer about whether it was right.

However, the estimates of CoD do not have to be perfect, they just have to be better than the alternative. That is why it is useful. The alternatives are very often even poorer quantifications or merely vague assertions.

One further word of caution. Don Reinertsen applied CoD to sizeable initiatives such as new product launches and significant projects. Applying the same technique (Weighted Shortest Job First, or WSJF) to small items such as "epics" or even user stories may be a stretch. The uncertainties involved in estimating value and the rate of loss of value, when considering the life-time benefits of these small items, are likely to result in inaccuracies that invalidate the results.

So when could we use WSJF

If you have read the preceding articles to this blog carefully, you will have noted a number of key assumptions that relate to the validity of the WSJF formula (Cost of Delay Divided by Duration, or CD3). Some of these make WSJF inapplicable for some processes. An example might be where, by continual monitoring of expected delivery dates against the delay cost profile, we can readily and dynamically reorder work schedules to preserve maximum value-delivery. Balancing the right types of work and managing risk by monitoring "last responsible moments" is a way of using CoD without using the WSJF formula, which does not account for variable CoD. Other aspects (such as difficulty in predicting value realization) make the technique inapplicable at smaller scales (for example small work items).

Another aspect which affects the applicability of WSJF, is the nature of the domain where we are seeking to order work. Chris Matts has certainly influenced my thinking in this area. Referencing Dave Snowden's Cynefin model [11], Chris points out that in "complex" domains results are not predictable or plannable. Safe-to-fail experiments lead to better outcomes than pre-planned actions (though not necessarily the "best" outcome, which is unknowable in such domains). So rather than preceding delivery with long periods of analysis and estimation, it is better to deliver smaller items and then choose subsequent items based on customer outcomes. This is an important observation, and coincides of course with many other ways of looking at the problem. Reducing the size of value-bearing work items, and reducing the lead times, so that feedback and response can happen quickly, is the right way to proceed in such domains. To summarise this advice with regards WSJF - don't use it in complex (or unplannable) domains! This is not just applicable to WSJF of course. If you are doing lots of up front planning any way, maybe your domain is not "complex" in this sense - or maybe you should question other practices as well!

So when can we use WSJF? Well not all domains are "unplannable", even domains where continuous feedback and adjustment are required. Not all work items are so small that estimating value and the decay of value is futile or too time-consuming. The most obvious place to look is where Don Reinertsen originally proposed the technique. For sequencing larger plannable items, which due to resource constraints or other reasons, follow each other in sequence. Not only is the WSJF formula useful in such discussions, it provides a means to discuss and manage portfolios of work using financial criteria that our accountants can understand and validate. We need accountants to be involved in this discussion, not least because it the surest way to move management decision making in the direction of greater business agility.

Where next?

WSJF of course is only one aspect of the application of Cost of Delay. The wider use of Cost of Delay in business, including the involvement of accountants in developing sound ways to apply its quantification, will in the end result in better business decisions and improved value delivery. While the minutiae of formulae and assumption validity, and the difficulty of estimating value-delivery and its decay, are certainly roadblocks in improving our understanding and good business practice in this area, the stakes are too high not to persevere towards robust solutions.

If you have persevered through the machinations of this series of blogs, I thank you - and look forward to hearing your feedback and experience reports. The next generation of managers needs clearer explanations of these concepts so they become as well understood as pre-tax profits and balance sheets in driving correct business actions. Accountants and agile managers need to join together to develop the mechanisms and standards that will augment current accounting practice and produce the environment for better business decision making.


References

[1] Donald G. Reinertsen. The Principles of Product Development Flow, (United States: Celeritas Publishing. 2009)

[2] David J. Anderson and Andy Carmichael, Essential Kanban Condensed. (United States: Lean Kanban University Press. 2016)

[3] David J. Anderson. Kanban: Successful Evolutionary Change for Your Technology Business (United States: Blue Hole Press, 2010)

[4] Joshua Arnold and Özlem Yüce. “Using Cost of Delay: Experience Report – Maersk Line.” Black Swan Farming. (2013)

[5] Preston G. Smith and Donald G. Reinertsen. Developing Products in Half the Time. (United States: John Wiley and Sons. 1998)

[6] Ian Carroll. “No Correlation Between Estimated Size and Actual Time Taken.” IanCarroll.com. (2016)

[7] Joshua Arnold. "Qualitative Cost of Delay." Black Swan Farming. (2016)

[8] Donald G. Reinertsen, David J. Anderson and Andy Carmichael. Meeting Minute. (September, 2016)

[9] Kanban Leadership Retreat Dubai, www.leankanban.com (2017)

[10] Magennis, Troy. 2016. Better Backlog Prioritization (from random to lifetime cost of delay). https://github.com/FocusedObjective/FocusedObjective.Resources/raw/master/Canvas%20and%20Forms/Better%20Backlog%20Prioritization.pdf

[11] Greg Brougham. The Cynefin Mini-Book: An Introduction to Complexity and the Cynefin Framework, C4Media for InfoQ. (2015)


Thursday, January 05, 2017

A "Qualitative" Formula for WSJF?

In this series of blogs we have been examining the use of Cost of Delay as a way of understanding ordering work - either from a quantitative approach using estimates for value, urgency, duration and/or size, or from a qualitative approach, such as the use of Delay Cost Profiles [1], Risk Profiles [2,3] or Value Size matrices [4]. The SAFe definition of WSJF is something of a hybrid, since it uses a formula, but a formula that has only "qualitative" value at best. Here is their definition [5]:


The 4 terms are determined by Planning Poker estimation using a Fibonacci scale (usually 1 to 20). The work items are ordered according to the formula following an estimation workshop. While this formula cannot provide a true quantitative analysis for ordering items to maximise value, some consultants using it have said that is a useful technique for the discussion it engenders among stakeholders. Once the numbers have been generated the items ordered, re-ordering to a better order is straightforward because of all the discussion that has preceded this point. Needless to say, I strongly disagree with this. While the discussion is necessary for a quantitative or qualitative approach, creating a spurious anchor from numbers which cannot be meaningful will lead to cognitive bias rather than better ordering.

Why can't the above formula provide meaningful answers? For 2 reasons:
  1. Dimensionally the formula is inconsistent
  2. The terms are not estimated on a proportional scale
These problems were addressed in Joshua Arnold's proposed modification to the formula [4] which rearranged the terms as follows:

"WSJF" = Time Criticality x (User-Business Value + Risk Reduction | Opportunity Enablement) / Size

Dimensionality is addressed, subject to the following assumptions:
  1. Time Criticality, Ï„, has units of the reciprocal of time (e.g. days-1). In other words an option expiring in 2 months would have double the Ï„ of one expiring in 4 months.
  2. User-Business Value and Risk Reduction | Opportunity Enablement are measured in consistent units, possibly using a weighting factor to translate the intangible values to the units of the tangible values
  3. Size is proportional to the blocking time caused by implementing the item. This term may in such a case be used as a proxy for duration measured in units of time. This issue has been addressed in this series here: WSJF - Should you divide by Lead Time or Size? which also identifies additional assumptions required for this to be true.
  4. WSJF itself is used consistently with its intended dimensions, which are value/time2
Proportionality must also be addressed. The scale used in estimating must be proportional (including 0 and not limiting maximum range) not just ordinal as would occur if the items with minimum and maximum value are set at say 1 and 20 respectively. The use of a weighting term to ensure the tangible and intangible business value terms are appropriately scaled relative to each other which is also required for proportionality.

The modified SAFe formula suggests a more general expression for WSJF using the weighting factors for a set of "business value types", v, and "exchange rates" that convert the values to a common "currency" of value:

WSJF = τΣ(vn Xn) / D

Ï„ (tau) is time criticality, vn is the nth business value, Xn is the exchange rate for this business value type, D is duration, for which Size may be a proxy subject to the assumptions discussed above.

This blog has not addressed the issue of when quantitative or qualitative approaches should be used. As well as having formulae that are coherent, the work of estimating to provide numbers for the formulae must be worthwhile and comprehensible to the business doing such estimation. In many cases it is not - for example where the domain or context in inherently "non-plannable". The concept of cost of delay is still important, but we should for different techniques for ordering work. Further discussion of this must wait for the next article in the series.

Previous blogs:


Part 1: Understanding Cost of Delay and its Use in Kanban 
Part 2: 
Delay Cost and Urgency Profiles
Part 3: 
How to Calculate WSJF
Part 4: 
WSJF - Should you divide by Lead Time or Size?
Part 5: A "Qualitative" Formula for WSJF? (this article)

Part 6: Time is an Asset - Delay is a Cost

References

[1] David J. Anderson and Andy Carmichael, Essential Kanban Condensed. (United States: Lean Kanban University Press. 2016)
[2] Anderson, David. 2015. ESP: Scaling the benefits of Kanban. Slides 45-49. April 23. http://www.slideshare.net/agilemanager/enterprise-services-planning-scaling-the-benefits-of-kanban (January 5, 2017).
[3] Sharvari, Sawant. 2016. "SwiftKanban help - risk module.". http://help.swiftkanban.com/getting-started/projects/metrics/esp-analytics/risk-management.html(January 5, 2017).
[4] Magennis, Troy. 2016. Better Backlog Prioritization (from random to lifetime cost of delay). https://github.com/FocusedObjective/FocusedObjective.Resources/raw/master/Canvas%20and%20Forms/Better%20Backlog%20Prioritization.pdf
[5] Agile, Scaled. 2016. "WSJF – scaled agile framework.". http://www.scaledagileframework.com/ wsjf/ (January 5, 2017).

Breakout sessions that ensure everyone in the meeting meets everyone else

Lockdown finds us doing more and more in online meetings, whether it's business, training, parties or families. It also finds us spendin...