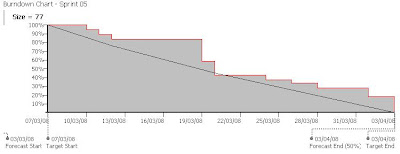
 This sprint completed the target 69 points although as can be seen by the slightly changed positions of the steps on the burndown, some individual tasks completed on different days to the forecast.
 The following sprint also completed 77 points, again showing the problem of "yesterday's weather" forecasting, albeit within a reasonably acceptable 10% margin of error. However the productivity measure is much more stable, only varying from 0.91 to 0.90.
 Here's the state of the current sprint. In this case we're forecasting 64 points to be completed.
To follow through a series of articles on Scrum in xProcess start with this article on "Using the pre-defined Scrum process".


No comments:
Post a Comment