A common question I get asked about estimating in xProcess (after three-point estimating of course, which is another popular question!) is: "What's the difference between a task's estimate for size and its (three-point) estimate for effort... and why do I need both?".
There are several ways to answer this, but perhaps a starting point is to ask why we think they're the same. If I ask you the size of your swimming pool you're more like to give me an answer in feet or metres that to reply with the number of person days it took to build the pool. (Building swimming pools is an xProcess application by the way - but that's another story!) When we are discussing the planning of a project the first thing to consider is the size (in whatever units are appropriate) of the deliverables of that project. Then we need a function (based on previous experience) to map from size to the estimate of the effort and consumables required to provide those deliverables.
Because the size of the things we want to deliver are measured in many different units, all of which we want to map eventually to an estimate of effort, it is common for projects to estimate directly in effort units such as person-days, person-hours or person-years. However if we do this, we lose a very important measure of the effectiveness of the project. Questions of team velocity or productivity become somewhat meaningless (except as a correction factor on original estimates of effort, compared to actual effort expended).
So if we can agree size is an important metric for projects, the next question is what units should it be estimated in, and can we compare the estimates with actuals at the end of the project. Software projects in particular are notoriously difficult to find an appropriate measure for size. Lines of source code is commonly used (because they are easy to count) but they don't readily map either to effective functionality delivered nor to effort required to develop them. Function points is another option and more recently "story points" (for an XP user story) or simply "points" have gained popularity where these are arbitrary units that are comparable only within the single project where they are being used. Another useful measure is "ideal-days" - in other words the amount that can be produced by a typical team member in a completely uninterrupted day. We rarely get such days (if ever) so it will take most of us more than a day to implement an ideal-day's worth of size. Nevertheless it is an understandable and reasonably verifiable measure of size.
In xProcess the units of size are common to the whole Data Source (they can be set in Data Source Preferences) and the value is used in several important places. When creating tasks the size value is often used in process patterns to set initial values for three-point estimates. The size units are used in burndown charts and earned-value plots to show progress of a project towards creating its deliverables. And size is also used to calculate productivity measures such as team velocity and software productivity.
Friday, March 30, 2007
Tuesday, March 20, 2007
Project Challenge! On your bike...
The National Motorcycle Museum in Birmingham was the setting for last week's Project Challenge exhibition. It was the first opprotunity to see the new Executive Dashboard for xProcess in action, as well as to hear yours truly speaking about process modeling as a route to improve project performance. Needless to say the Executive Dashboard was clearly the highlight!

Guy's interest in the dashboard in this photo is not merely a pose for the camera. The show was also the first opportunity for the sales team to see this feature, which was turning a lot of heads (not just ours!). The ability to create additional views of interesting project data "on-the-fly" is a particularly impressive aspect of the facility.

Guy's interest in the dashboard in this photo is not merely a pose for the camera. The show was also the first opportunity for the sales team to see this feature, which was turning a lot of heads (not just ours!). The ability to create additional views of interesting project data "on-the-fly" is a particularly impressive aspect of the facility.
Thursday, March 08, 2007
Don't burn out... Burn Down!
Following in the tradition of you heard it here first, here's another sneak preview of soon to be released functionality on xProcess. The burndown chart is a key visualisation that was developed in Scrum and now used with a number of agile methods. Currently you can use the reporting feature in xProcess to generate a burndown chart for your project or timebox. However there's a new feature in the wings that shows you the burndown instantly (history and forecast) on any project, parent task or folder. Here's an example:

This timebox (Timebox 01) runs for about 3 weeks and the scope of work targeted is forecast to complete right at the end of the timebox -- indeed a couple of the tasks are alread critical. (This diagram is looking forward, predicting when tasks will close, and thus when the work in each task will burn down). Look at the same time box a couple of days later.
 Now -- perhaps because tasks have been re-estimated or resources changed -- we can see some tasks are forecast to finish beyound the end of the timebox. The chart is consequently shown as "red" status. Even at this early stage in the timebox we can predict that some deliverables are at risk and so take appropriate action. In this case some additional resources have been found and the some tasks excluded from the targets. Once the changes have been made, the effect can be seen and assessed immediately...
 The timebox is "green" and all systems are go! Day by day as the timebox progresses we can monitor our progress and ensure the whole team stays on track!
When we visit the team half way through the timebox we can see from the burn down chart that they are still very much on track and confidence will be high that this team will deliver on its promises.

Subscribe to:
Posts (Atom)
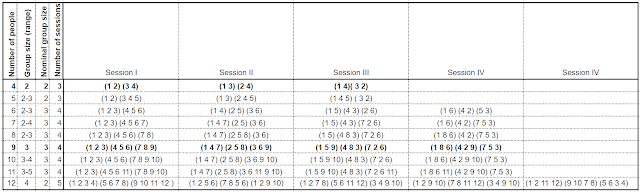
Breakout sessions that ensure everyone in the meeting meets everyone else
Lockdown finds us doing more and more in online meetings, whether it's business, training, parties or families. It also finds us spendin...
-
Ron Lichty is well known in the Software Engineering community on the West Coast as a practitioner, as a seasoned project manager of many su...
-
 Cost of Delay (CoD) is a vital concept to understand in product development. It should be a guide to the ordering of work items, even if - ...
 -
 When starting to use xProcess there are a number of terms that may be unfamiliar. What for example is an "overhead" task? In gener...